Accelerate Spring Boot APP Start Time - Simply
Introduction
The startup time of a Spring Boot Application is critical for several factors:
- During development, developers need to restart the application several times
- Integration and component tests needs to be as fast as possible to increase any pipeline build time, and usually during those you need to bootstrap a lot of Components
- Deploy needs to be as fast as possible, in order to increase reliability and faster scaling
- In the remote case we are using Spring Boot with a cloud serverless function, it’s important to get rid of any cold-start, and the equation “time == money” applies
What we are considering in this article REALLY is a series of configurations we can apply without disruptive changes.
We will measure the startup of a SpringBoot 3.3 Application with JDK 21 and some pretty standard integrations as Postgres, Firebase and Redis. Also Swagger and OpenAPI documenting my Madness.

Photo by Clement Souchet on Unsplash
What we will not talk about:
GraalVM. I will not consider it in here because it’s not free lunch, so hold your horses. It comes with a series of limitations when it comes to reflection and dynamic class loading, and most of the application that are currently using Spring Boot are not easily compatible with it.
Virtual Threads. I’ve already tried them with Spring Boot and posted an article on Baeldung Spring 6 Virtual Threads and Medium Java Virtual Threads also applying some load testing Spring Boot 3 With Java 19 Virtual Threads, but, in this case, unfortunately, after several tests I didn’t notice any major improvement in the startup time. So… no Virtual Threads.
Check The Logs!
First thing we do is: check the logs. If the log is too verbose, it could have impact on everything, startup included.
Putting things to the extreme, I tried to start my app with com.*, org.* and io.* at TRACE level and I had a roughly 300ms delay on application start. It’s not a lot, but considering that I’m testing on an amazing Apple M3 Pro with a lot of CPU. Writing Logs takes up a lot of CPU cycles being IO intensive, and even if run in a separate thread, when the resources are a limit, decreasing log level is important.
# Are you crazy?
logging:
    level:
        org: TRACE
        com: TRACE
        io: TRACE
Check the Components Initialized at start!
Spring automatically initialize A LOT of components eagerly when the application starts. We can look at the generated by the spring-startup-report tool - enabling this report is really easy: (it’s enough to add the dependency and then hit the http://host:port/startup-report url)
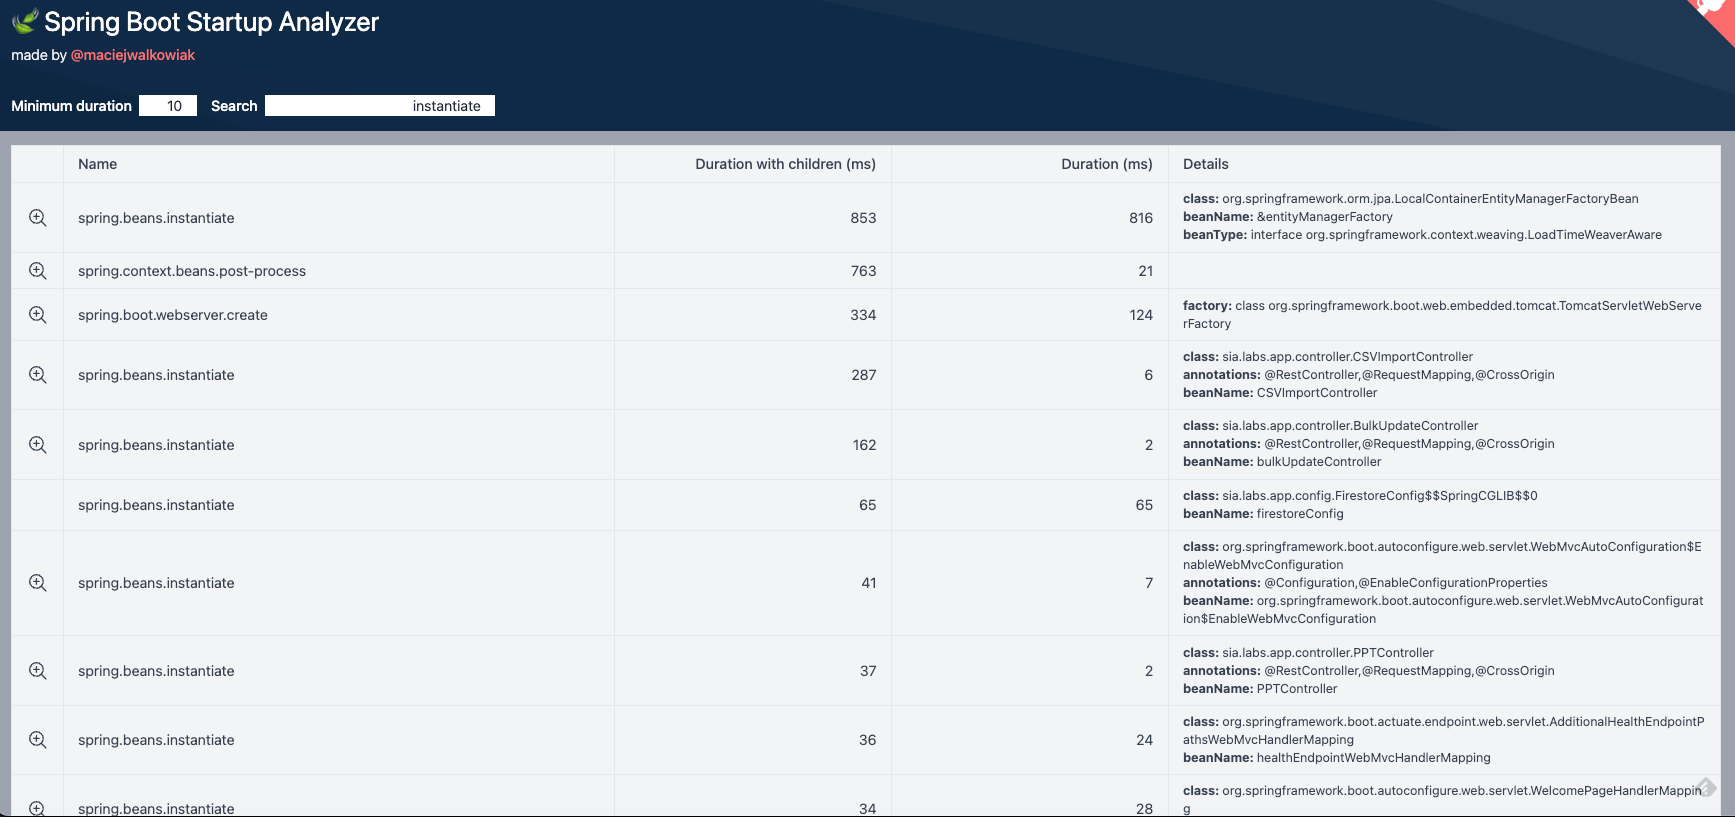
Spring boot startup report before
But do we really need all those spring-initialize calls? Let’s get rid of some of the init by using:
spring:
  main:
    lazy-initialization: true
Those are the astonishing results:
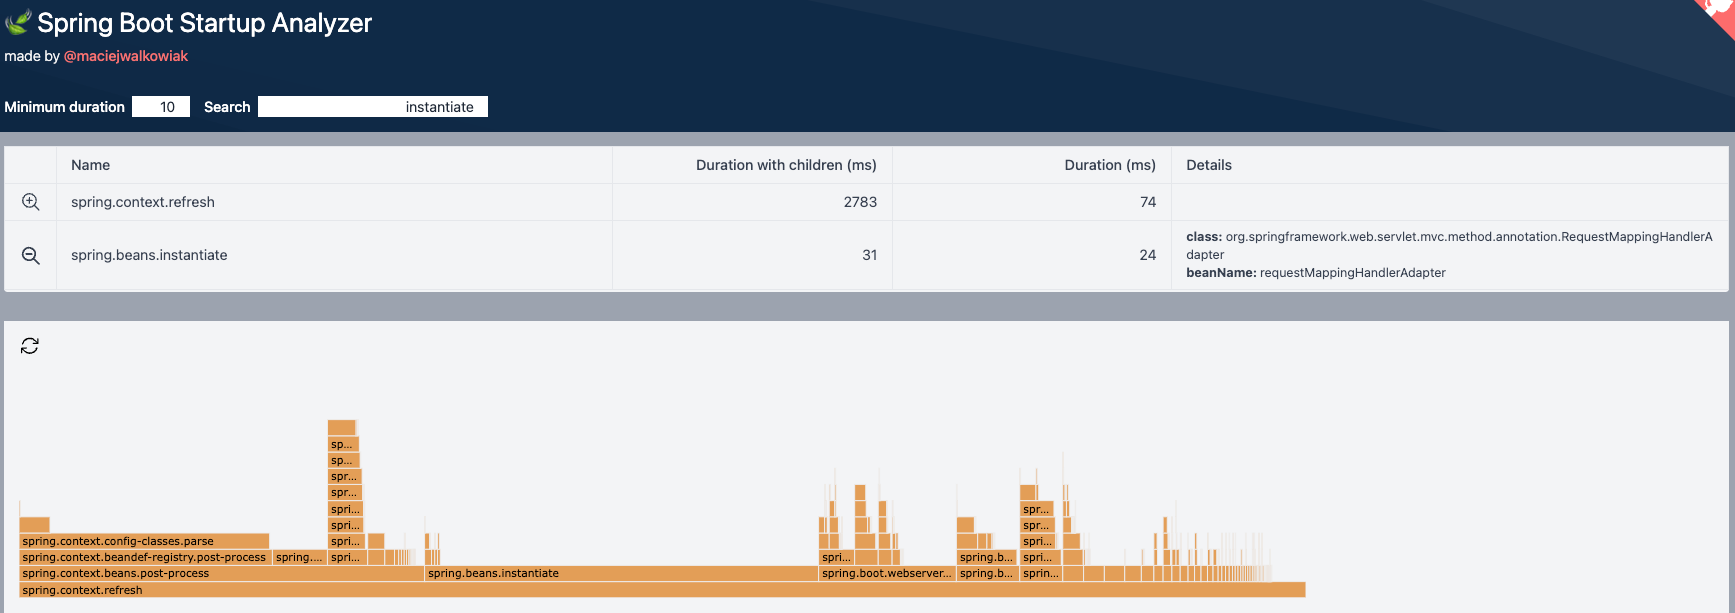
Spring boot startup report after
Bringing down the application start from 4.418 ms to 2.836 ms - it’s like a LOT of milliseconds! But wait, all that glitters is not gold.. Lazy init means that when we will actually need those components, we need to initialize them - thus the first request, say, for example, in needing the Firebase connection and config, will be extremely slow.
What we can do to fine-tune this is put the @Lazy annotation on some peculiar components and leave the default spring config to Eagerly initialize everything. Also, exclude some [auto-configurations] (https://docs.spring.io/spring-boot/docs/1.4.x/reference/html/using-boot-auto-configuration.html#using-boot-disabling-specific-auto-configuration) that we don’t really need.
Decompress the JAR!
The vast majority of docker files for Spring Boot App are made like this:
# Use the Gradle or maven Wrapper to build the application
RUN ./gradlew bootJar
# Run the standalone jar file
CMD java -jar build/libs/*.jar
Starting With Spring Boot 3.3 There is a super simple way to decompress the files of the application in a way that it makes it easier to load the classes in memory (avoid the Jar within Jar) and hence startup the application faster. So I’ll first decompress, and then RUN.
Let’s modify the dockerfile like this:
# Use the Gradle or maven Wrapper to build the application
RUN ./gradlew bootJar

# Expand jar for fast startup and less memory usage
RUN java -Djarmode=tools -jar build/libs/*-*-SNAPSHOT.jar extract --destination fast-jar --force

# Run the standalone jar file
CMD java -jar fast-jar/-*-SNAPSHOT.jar
On my peculiar application and my peculiar host machine, I was able to reduce the startup time of approximately 500ms with this simple config.
Class Data Sharing (CDS) Anyone?
CDS in Spring Boot for dummies:
1) you do a TRAINING run of your Spring Boot App
2) This TRAINING run output is a FILE *.jsa
3) This .jsa file is then used to start the application faster
The commands in practice are those:
# training run
java -XX:ArchiveClassesAtExit=application.jsa -Dspring.context.exit=onRefresh -jar fast-jar/sia-be-*-SNAPSHOT.jar
# execution
java -Xshare:on -XX:SharedArchiveFile=application.jsa -jar "fast-jar/$JAR_NAME"
On my host, I managed to remove approximately one ENTIRE Second (1.000 ms) delay. Yeah; it’s amazing. The problem with this configuration is that it might become messy when it comes to build files and containers.
That’s why the Spring Team is suggesting to use buildpack or the standard bootBuildImage spring plugin command. In this case, if you want to enable CDS, is as simple as adding an environment variable to the gradle task:
import org.springframework.boot.gradle.tasks.bundling.BootBuildImage

plugins {
    id("org.springframework.boot") version "3.3.0"
    ...
}

tasks.withType(BootBuildImage::class){
    environment = mapOf("BP_JVM_CDS_ENABLED" to "true")
}
Tiered compilations and -noverify JVM flags
We could avoid compiling some part of the applications in advance, or skipping entirely the C2 layer Compiler optimization. This of course can result in some performance improvements when it comes to starting up a Java process. This can have some minor disadvantages in performance loss at method level.
java -Xshare:on -XX:TieredStopAtLevel=1 -XX:SharedArchiveFile=application.jsa -jar "fast-jar/$JAR_NAME" > pipe & PID=$!While this was exceptionally useful with old JVM versions, in new version as the 21 I’ve noticed minor performance improvements, approximately 70ms. Probably this will hurt more than do some good.
Negative things to say also about the “-noverify” flag. This flag will make us able to run a JVM app without checking the bytecode produced. This can result in errors at runtime in later part of the process, that could have been identified earlier, at startup. Veeery risky to use, in fact, this flag has been deprecated.
Conclusion, Results, and Testing Script
In this article we have seen some simple configurations that makes us able to reduce the loading time of a spring boot application considerably. Without even a drop of sweat.
This is the table of the enhancements on the startup time I managed to get (again, this is on my peculiar application), so take those with a grain of salt:
- Trace .* Logs: 4.694 sec
- Info Logs: 4.418 sec
- Lazy Init: 2.836 sec
- Jar extracted: 2.980 sec
- Jar extracted + CDS training run: 2.155
- Jar extracted + CDS training run + lazy init: 1.935 sec
- Jar extracted + CDS training run + lazy init + disabled tiered comp: 1.866 sec
CODE: I’ve tested the whole process using this script on gist github.com
Thanks!