AWS Lambda with Java: Build, Deploy, Expose, Trace and Monitor

Photo by Tabea Schimpf on Unspash
Introduction
Distributed tracing and troubleshooting in a cloud environment presents a series of challenges. In the world of microservices, where thousands of software components are distributed across various regions, understanding what went wrong in a specific transaction is not easy. That’s why in the past years a series of tools have been created with the goal of helping developers analyze distributed transactions in the most straightforward way possible.
In this article, we’ll implement a component of a distributed system in the AWS Cloud Environment: a Lambda serverless function. First, we’ll create and deploy a Java11-based function using Gradle and the AWS CLI with CloudFormation. Then, we will expose it through the internet. Finally, we’ll implement tracing and monitoring using Lumigo.
All the code given here is available on GitHub. So let’s jump straight into it.
Build
Instrumenting code for building a Lambda AWS function in Java is pretty straightforward, especially if you use Gradle. You just need to add the following dependencies in the build.gradle file:
implementation 'com.amazonaws:aws-lambda-java-core:1.2.1'
implementation 'com.amazonaws:aws-lambda-java-events:3.11.0'
And the following task is used to build a ZIP file containing the compiled code and needed libraries:
task buildZip(type: Zip) {
    from compileJava
    from processResources
    into('lib') {
        from configurations.runtimeClasspath
    }
}
If we run “gradle build”, a ZIP file containing our compiled classes and all the needed runtime libraries will be created in the folder “build/distributions/java-basic.zip”.
Next, we can then implement the AWS Generic Handler class. The Class RequestHandler is provided in the “aws-lambda-java-core” library. The input type and output type APIGatewayV2HTTPEvent and APIGatewayV2HTTPResponse (the name is not so self-explanatory) are used instead in case we want to parse URL parameters. Those classes are provided in the “aws-lambda-java-events” library.
In this case, our business logic is simply getting the value of the temperature as a query parameter, and converting it from Fahrenheit to Celsius:
public class HandlerTemperatureConversion implements RequestHandler<APIGatewayV2HTTPEvent, APIGatewayV2HTTPResponse> {

    @Override
    public APIGatewayV2HTTPResponse handleRequest(APIGatewayV2HTTPEvent event, Context context) {
    LambdaLogger logger = context.getLogger();

    logger.log("EVENT TYPE: " + event.getClass().toString());

    Map<String, String> param = event.getQueryStringParameters();
    logger.log("QueryParams:" + param.toString());

    String temp = param.get("temperature");
    logger.log("Converting Fahrenheit: " + temp);

    double fahrenheit = Double.parseDouble(temp);
    double celsius = fahrenheit - 32;
    celsius = (int) (celsius / 1.8);

    APIGatewayV2HTTPResponse response = new APIGatewayV2HTTPResponse();
    response.setIsBase64Encoded(false);
    response.setStatusCode(200);
    Map<String, String> headers = new HashMap<>();
    headers.put("Content-Type", "application/json");
    response.setHeaders(headers);
    response.setBody("{ temperature: " + celsius + "}");
    return response;

    }
}
Deploy
We now need to deploy this function to the cloud. The only prerequisite for deploying this Lambda in AWS is to have the AWS CLI installed and configured (and an AWS account, of course. If you have just started experimenting, make sure to have the free-tier budget and duration under control).
When it comes to deploying a Lambda function, we can select the ZIP file manually or we can deploy it in an S3 Bucket. The manual operation is error-prone and breaks the automatic flow of operations that a CI/CD pipeline could have. So let’s create the bucket with a random ID postfix, to avoid naming conflicts:
#!/bin/bash
BUCKET_ID=$(dd if=/dev/random bs=8 count=1 2>/dev/null | od -An -tx1 | tr -d ' \t\n')
BUCKET_NAME=lambda-artifacts-$BUCKET_ID
echo $BUCKET_NAME > bucket-name.txt
aws s3 mb s3://$BUCKET_NAME
Let’s now define a template file to deploy the Lambda using CloudFormation:
AWSTemplateFormatVersion: '2010-09-09'
Transform: 'AWS::Serverless-2016-10-31'
Description: An AWS Lambda application that calls the Lambda API.
    Resources:
        function:
        Type: AWS::Serverless::Function
        Properties:
            CodeUri: build/distributions/java-basic.zip
            Handler: gae.piaz.aws.HandlerTemperatureConversion
            Runtime: java11
            Description: Java function
            MemorySize: 1024
            Timeout: 10
            # Function's execution role
            Policies:
            - AWSLambdaBasicExecutionRole
              - AWSLambda_ReadOnlyAccess
              - AWSXrayWriteOnlyAccess
              - AWSLambdaVPCAccessExecutionRole
              Tracing: Active
We can now deploy the Lambda using this template file.
#!/bin/bash
set -eo pipefail
ARTIFACT_BUCKET=$(cat bucket-name.txt)
TEMPLATE=template.yml
gradle build -i
aws cloudformation package --template-file $TEMPLATE --s3-bucket $ARTIFACT_BUCKET --output-template-file out.yml
aws cloudformation deploy --template-file out.yml --stack-name java-basic --capabilities CAPABILITY_NAMED_IAM
Expose and Test
We now want to expose the AWS Lambda as an HTTPS endpoint. For the sake of simplicity, in this case, I’ve made the endpoint unprotected and available to the internet (beware, anyone with the public URL can invoke the function and consume AWS’s free-tier limited resources!).
#!/bin/bash
set -eo pipefail
FUNCTION=$(aws cloudformation describe-stack-resource --stack-name java-basic --logical-resource-id function --query 'StackResourceDetail.PhysicalResourceId' --output text)
aws lambda create-function-url-config --function-name $FUNCTION --auth-type NONE
aws lambda add-permission --function-name $FUNCTION --action lambda:InvokeFunctionUrl --statement-id https --principal "*" --function-url-auth-type NONE --output text
This script will output the URL of the function to call. To test the endpoint, we just need to provide the temperature as a query parameter in the URL (after the slash):
$ curl https://<uuid>.lambda-url.<zone>.on.aws/?temperature=100
$ { temperature: 37.0 }
Monitor
When tracing and monitoring an AWS Lambda function we have a series of options available, such as AWSXray or Jaeger. In this case, we will use Lumigo, a tool I’m using for microservices troubleshooting that is specifically built to handle distributed tracing in cloud environments.
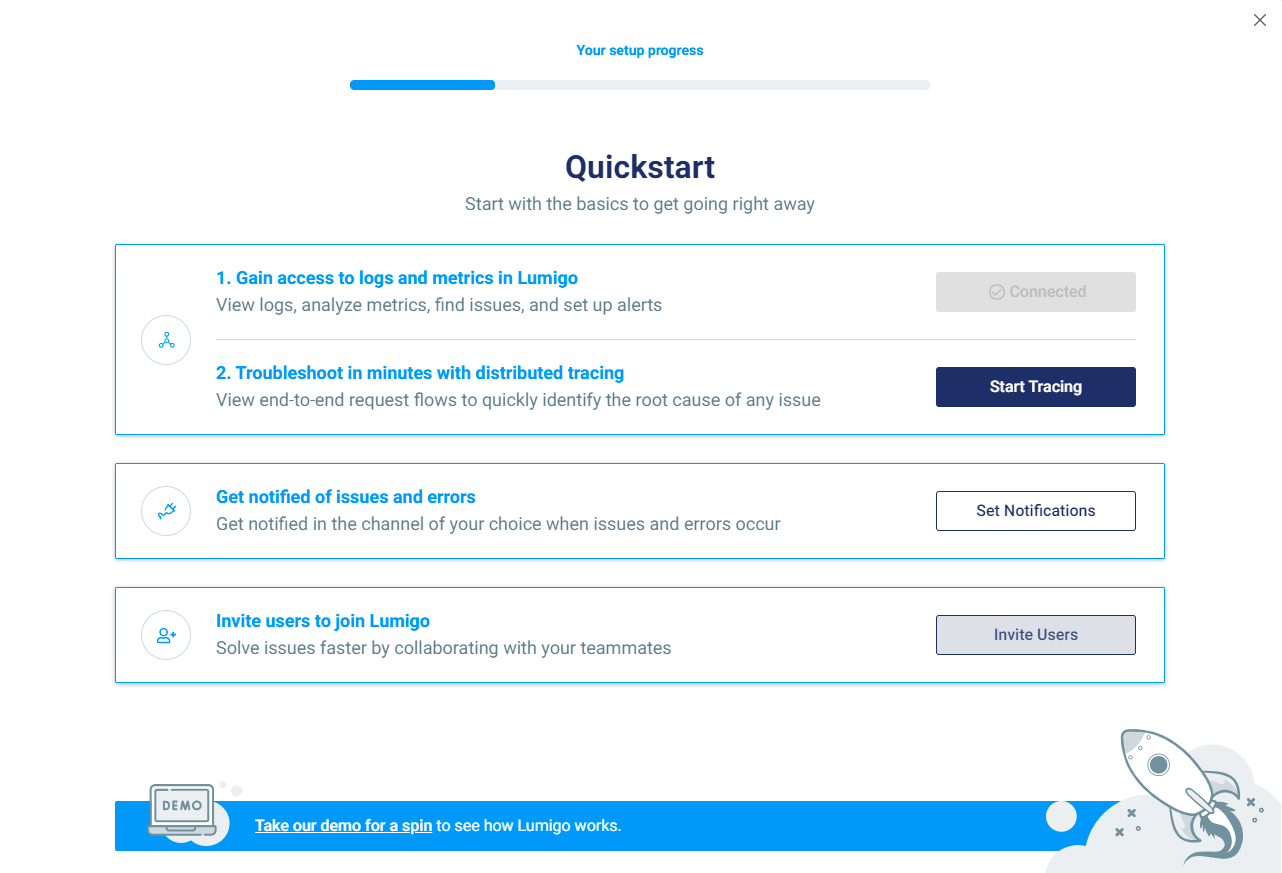
You can use the 14-day free trial with up to 150K Traces to test out its features. To begin with, you need to visit their website and create an account. After registering, the first thing to do is to grant Lumigo the permits to install with CloudFormation the needed components in our cluster following the Quickstart easy guide:

Then we will already see all our function invocation and failures:

If we click on “functions”, we can see details and access logs of single calls and traces in a convenient dashboard which includes the costs, last modification, and cold-starts tracking of our Lambdas:

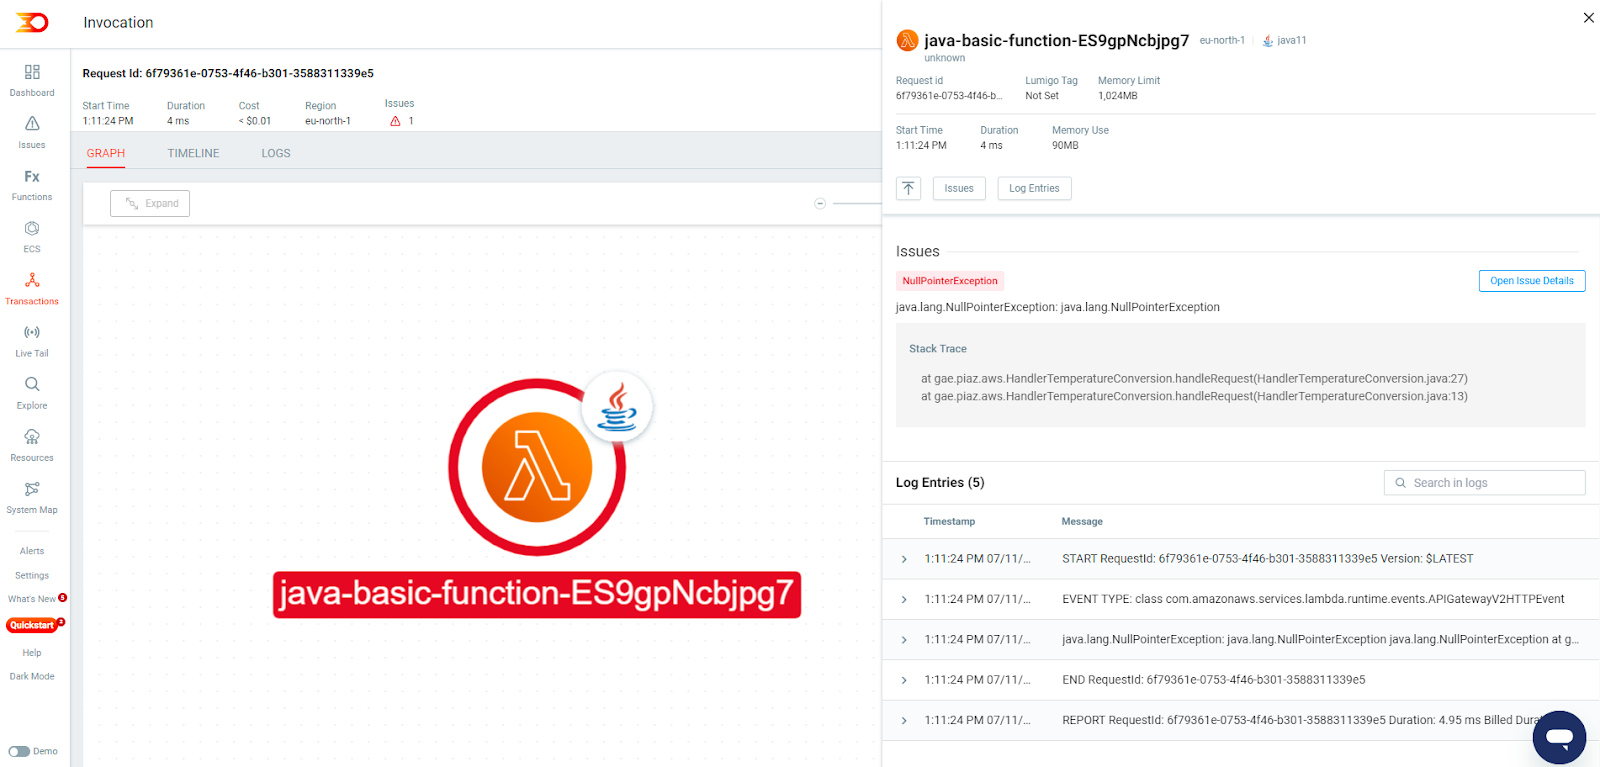
If we try to hit our endpoint without passing the temperature value, we will have an error. If we click on the error invocation present in the dashboard, Lumigo will tell us the issue:

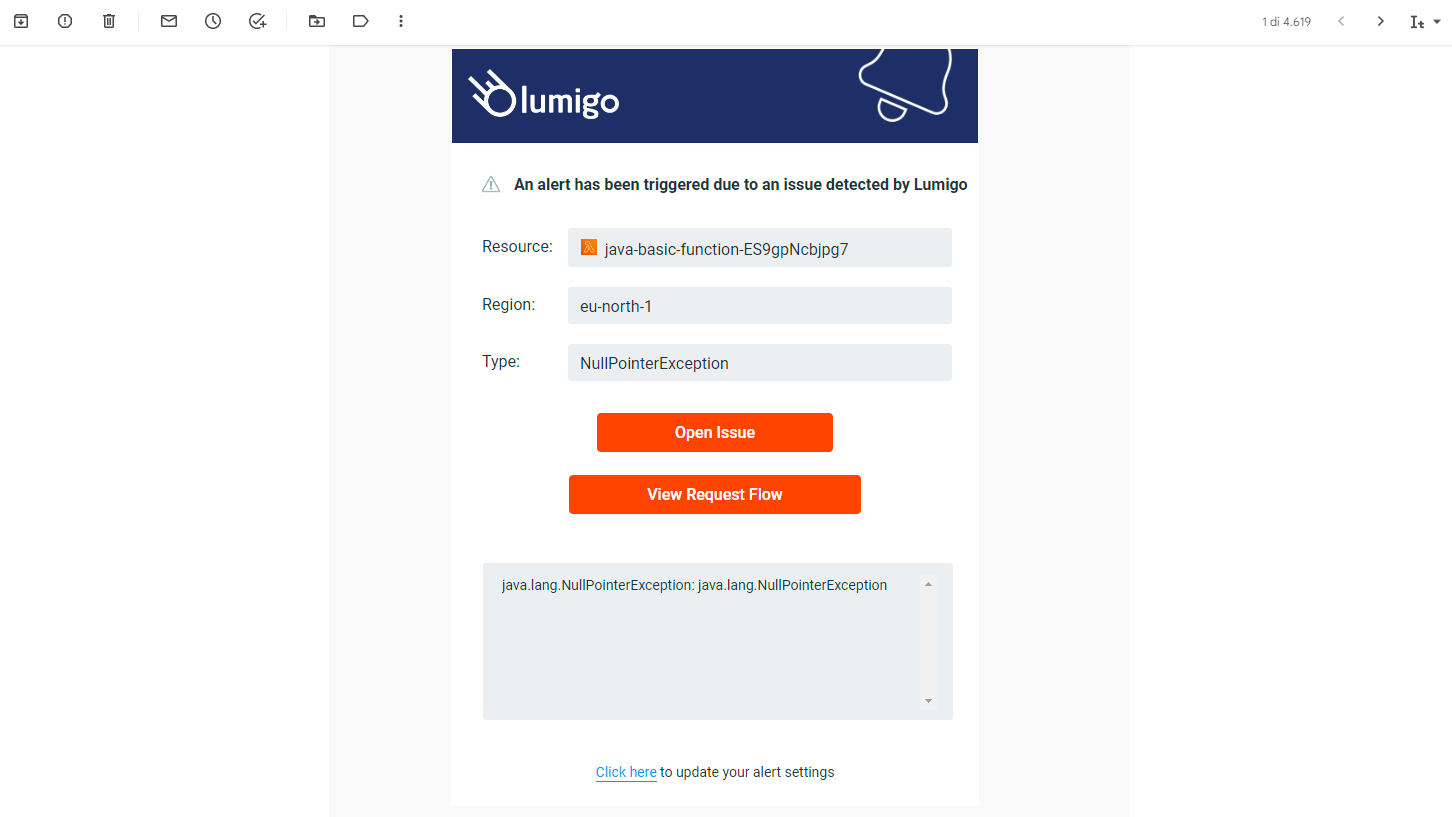
We will also automatically and immediately receive an email with an alert reported for this failed invocation without any further configurations:

Trace
All the functions added are not signed as “traced” automatically by Lumigo. That’s because Java11 is not a supported runtime for auto-tracing:

As suggested in this case, we have to do some simple manual instrumentation. First of all, we need to add the Limingo library repository to the Gradle repository list together with the lumigo.io/java-tracer library:
repositories {
    mavenCentral()
    maven {
        url "https://raw.githubusercontent.com/lumigo-io/java-tracer/master/local-repository"
    }
}
Then we have to init the Lumigo configuration and wrap the execution of our Lambda in a java.util.function.Supplier:
static {
    LumigoConfiguration.builder().build().init();
}

@Override
public APIGatewayV2HTTPResponse handleRequest(APIGatewayV2HTTPEvent event, Context context) {

    Supplier<APIGatewayV2HTTPResponse> supplier = () -> {
       // body...
};

return LumigoRequestExecutor.execute(event, context, supplier);
}
Then, we need to add the Lumigo token that can be found in Settings -> Tracing -> Manual Tracing as an ENVIRONMENT VARIABLE configured for our AWS Lambda function. We can add the variable by running this simple script (we also need the JAVA_TOOL_OPTIONS):
#!/bin/bash
set -eo pipefail
FUNCTION=$(aws cloudformation describe-stack-resource --stack-name java-basic --logical-resource-id function --query 'StackResourceDetail.PhysicalResourceId' --output text)
aws lambda update-function-configuration --function-name FUNCTION \
--environment "Variables={LUMIGO_TRACER_TOKEN=$1,JAVA_TOOL_OPTIONS='-Djdk.attach.allowAttachSelf=true'}"
This will add the following environment variables to our function:

It will give us the ability to see a lot of additional information for a single execution:

Conclusion
In this short tutorial, we have implemented and deployed a modern component of a distributed system in a Cloud Environment and we effectively added distributed tracing and monitoring to it.
Specifically, we have seen how it’s possible to build an AWS Java Lambda function with Gradle, deploy it using CloudFormation, and expose the URL access with HTTPS. Finally, we added Lumigo to our stack in order to monitor the function. With some easy manual instrumentation, we have also added Lumigo distributed tracing to our Lambda.